DUE DATE: < Listed In Course Schedule >
|
You are allowed to work in PAIRs or BY YOURSELF for this assignment. A pair is no more than two people. You may complete this assignment on your own if you wish. If you work with a partner then please put BOTH your names at the top of all the .CS files (in comments) then have ONE of you hand in the assignment to StudentTracker.
|
Learning Objectives:
(This is a list of the major topics that you, as
students, will learn in this
assignment:)
Let's say that we're interested in how students learn computer programming and computer science. We're wondering if students have difficulty in programming courses because programming courses (much like math courses) are highly sequential. Because of this we're worried that if a student fails to learn a given topic then they'll have a lot of trouble learning any of the topics that follow the given topic.
One way that we might approach this is to simulate students learning topics in the way we described above (namely, once they fail to learn a topic they stop and don't learn any of the topics that follow). Once we've simulated students learing in this way we can then see if the simulated students' grades are similar to our real students' grades. If the grades are similar then it's possible that students are learning in the way we proposed. It's important to understand that this is not guaranteed to be the reason why the simulated students' grades look like the real students grades: we would need to conduct further investigation in the real world to determine if this is actually true. However, if the simulated students' grades look different than the real students' grades then this would imply that students do NOT learn material in the way described above.
For this assignment we're going to simplify things in several different ways. We're going to assume that each student either learns a topic or they don't (we're going to assume that the students' learning is binary/boolean, instead of the more realistic idea that students can learn a portion of a topic even if they don't learn all of it). We're only going to simulate how many topics the students learn (without then converting that number to a GPA), with the understanding that GPA should be directly proportional to learning anyways.
The basic plan for simulating students' learning is as follows:
For each student we should do the following:
Simulate the student's learning for each topic
We do thsi by randomly determining if the student learned the topic or not
(For our purposes we'll assume that there's a percentage chance that
each student learns any given topic, which you should represent
using a floating point value between 0 and 1. 1 means that the
student has a 100% chance of learning each topic, 0.6 means they
have a 60% chance, and 0 means they have a 0% chance).
If they did learn the topic then remember that they've learned an additional topic, and then repeat this process
If they didn't learn the topic, then stop going through the topics for each
student.
(note that this is "Variation #1",
as mentioned below)
Once we've figured out how many topics they've learned we want to
increment a counter that keeps track of how many students learned that
many topics.
In other words, if the current student learned 7
topics out of 20, we should increment our '7 topics' counter.
HINT:
If you've got 20 topics, do you really want to create 20 separate,
named, variables to keep track of each counter? Is there a better
way to do this?
At this point we should go back and simulate the next student, until we've simulated all the students.
Once we've simulated all the students we should display our results to
the user.
Here's an example of output, along with a description of
what the output means:
| Sample Output | Explanation |
=== Topics Learned Independently === Percent chance of learning a given topic: 50% 20 topics and 50 students: # Topics : # Students who Learned this many topics (count, then bar) 0: 0 1: 0 2: 0 3: 0 4: 0 5: 0 6: 4 **** 7: 4 **** 8: 4 **** 9: 11 *********** 10: 8 ******** 11: 6 ****** 12: 10 ********** 13: 2 ** 14: 1 * 15: 0 16: 0 17: 0 18: 0 19: 0 20: 0 |
"Topics Learned Independently" tells the user that we're running the variation where failing to learn a topic has no penalty
"Percent chance..." tells the user that we're using 0.5 (50%) as the percentage chance that each student learns any given topic "20 topics and 50 students" tells the user that we simulated a class of 50 students, and that there were 20 topics in the course. 6: 4 ****
On the above line we're trying to convey how many students learned a total
of 6 topics. In this particular run of the program 4 students learned
exactly 6 topics. After printing out 6 (the number of topics learned)
and 4 (the number of students who learned that many topics) we then print
out 4 stars in order to create 'horizontal histogram' / bar chart.You can use the tab character in order to better line up the columns, like so: Console.WriteLine("A\tB\tC");This is the equivalent of typing A, then pressing the tab key, then B, then the tab key again, then C |
Once we've simulated a class of students with a given percentage chance of learning
each topic you should go on and do the simulation over, this time using the
next percentage chance.
In the above example the simulation used 50%.
After running the simulation the program should go back and try it again
with the 90% percent chance of learning.
After we've run our simluation, which should compare the simulated
results to 'real' results and see if the simulation seems to accurately
describe the real data.
You will do this in part 2,
below.
However, instead of doing a single simulation you're going to try two variations:
You must include both variations in the code that you submit for your homework, and you must clearly indicate (using comments) which code is specific to which varation.
Your task is to write a several variations of a program that will simulate students' learning, as described above.
An example of the output is given below. Your program is required to produce this output. (Minor variations, like extra spaces, punctuation, or different phrasing is acceptable, but you must print all the information, in the same general format). (And since the simulation uses random numbers your program will generate slightly different results each time you run it). Make the columns of the table line up as best you can.
Important Details:
|
Example Output |
=== Topics Learned Independently === Percent chance of learning a given topic: 50% 20 topics and 50 students: # Topics : # Students who Learned this many topics (count, then bar) 0: 0 1: 0 2: 0 3: 0 4: 0 5: 0 6: 4 **** 7: 4 **** 8: 4 **** 9: 11 *********** 10: 8 ******** 11: 6 ****** 12: 10 ********** 13: 2 ** 14: 1 * 15: 0 16: 0 17: 0 18: 0 19: 0 20: 0 === Topics Learned Independently === Percent chance of learning a given topic: 90% 20 topics and 50 students: # Topics : # Students who Learned this many topics (count, then bar) 0: 0 1: 0 2: 0 3: 0 4: 0 5: 0 6: 0 7: 0 8: 0 9: 0 10: 0 11: 0 12: 0 13: 0 14: 1 * 15: 3 *** 16: 4 **** 17: 9 ********* 18: 10 ********** 19: 17 ***************** 20: 6 ****** === Stop When Topic Isn't Learned === Percent chance of learning a given topic: 50% 20 topics and 50 students: # Topics : # Students who Learned this many topics (count, then bar) 0: 26 ************************** 1: 12 ************ 2: 4 **** 3: 2 ** 4: 4 **** 5: 0 6: 1 * 7: 1 * 8: 0 9: 0 10: 0 11: 0 12: 0 13: 0 14: 0 15: 0 16: 0 17: 0 18: 0 19: 0 20: 0 === Stop When Topic Isn't Learned === Percent chance of learning a given topic: 90% 20 topics and 50 students: # Topics : # Students who Learned this many topics (count, then bar) 0: 2 ** 1: 1 * 2: 9 ********* 3: 9 ********* 4: 2 ** 5: 4 **** 6: 2 ** 7: 0 8: 1 * 9: 2 ** 10: 2 ** 11: 3 *** 12: 1 * 13: 2 ** 14: 0 15: 2 ** 16: 1 * 17: 0 18: 0 19: 0 20: 7 ******* Press any key to continue . . . |
Your goal for this section is to discuss whether the results your simulation generated seem to be consistent with the results semi-randomly generated for two made-up classes.
You should read through this section immediately, but you'll need to wait to do this work until your program runs correctly .
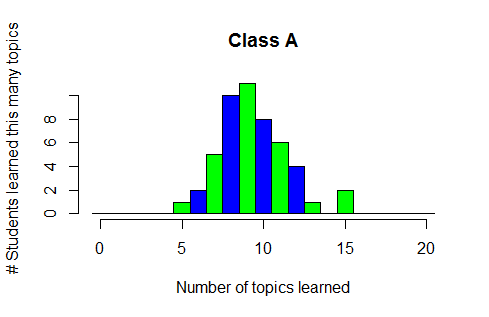
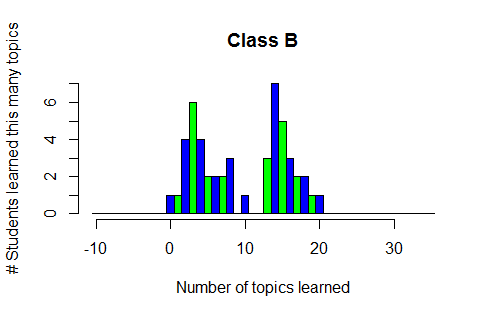
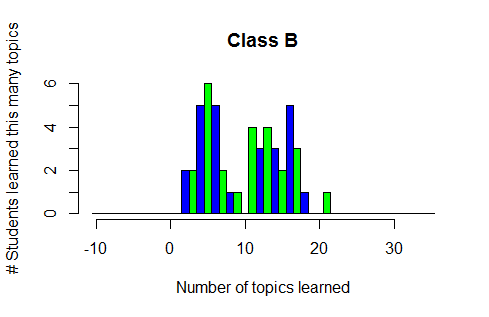
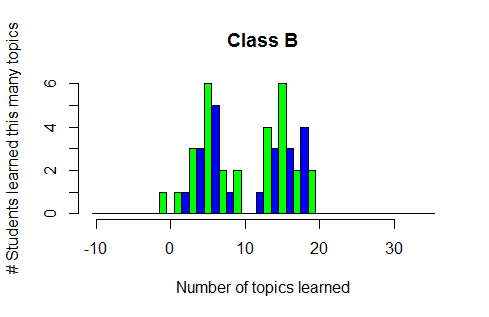
In this section we're going to revisit our original motivation for running the simulation: is Variation 1 or Variation 2 a plausible explanation for how students are learning in a given class? However, instead of looking at real data (which can be both messy and may have legal restrictions on how it's shared) we're going to look at randomly generated data for several different hypothetical classes. Your goal for this section is to discuss whether the results your simulation generated seem to be consistent with the results semi-randomly generated for two made-up classes: Class A and Class B (the idea is that "Class A" might be, say, the 2016 Fall offering of the course we're simulating, and "Class B" might be, say, the 2017 Fall offering of that same course.
Run your program and then copy the results into a file that you can hand in (so that I can see the results you're using). If you need help copying things out of the Windows console please try searching the Internet for "how to copy from windows cmd". Once you've done that look at the results that you're getting for the "Topics Learned Independently" (Variation 1) and the "Stop When Topic Isn't Learned" (Variation 2) that your program generates. Since you ran each simulation twice (once with a 50% percentage chance of learning each topic, and again with a 90% chance) you can use this information to get a better feel for the overall trend in each variation.
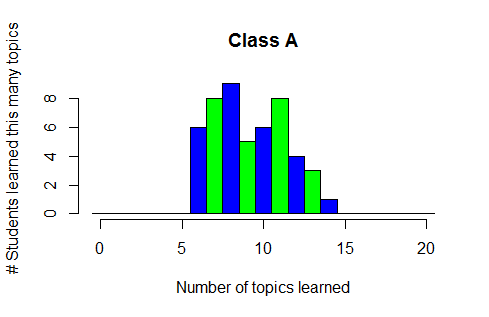
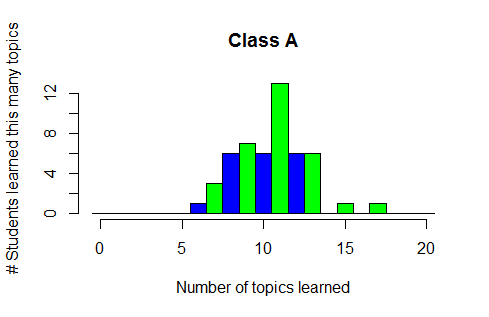
Next, look over the following example results from Class A, and think about whether your data is a similar (or not) to these results. Look for overall patterns, but don't look at the details too closely. You're being given 3 examples of each class (A / B) in order to get a feel for the overall 'shape' of the data - for example, the 2 people who learned 15 topics in the first Class A example aren't really important for the overall shape (notice that the other two examples do NOT have a small spike towards the right end of the seen values - the two people who learned exactly 15 topics was a random event, not part of the overall pattern.). Note - if we were really doing an experiment like this we'd use a more mathematically rigorous way of doing this comparison, but this course looking at graphs is fine.
(You can click on each image to enlarge it)
At this point there are two combinations to look at:
For each combination, write an explanation that explains whether the simulated results seem to match the samples you're looking at for Class A. If they do match, what might this say about the underlying learning processes of the students in that class? If the results don't match, what does that say?
Once you've done that you should look at the made-up results for Class B, and again discuss (in writing) your results for
NOTE: You must write at least 1 full, single-spaced page of text in your discussion. The page should be written in a normal/typical font at a normal/typical size (for example, Times New Roman 12 point, or Calibri 11 point). If you don't fill the page points will be deducted. There is no bonus for going over a page; you are encouraged to fill the page and then stop as soon as possible after that. It's recommended that you start with a short paragraph that summarizes your results, and then have a paragraph for each of the four combinations listed above.
Rationale for the 1 page of single-spaced text: Forcing everyone to write about a page is a mechanism to force everyone to develop some quality thoughts, and to explain them a bit, without forcing people to write a vast amount. Not listing a minimum length results in some people submitting a couple sentences for this entire part; requiring multiple pages of writing tends to force people to fill the paper will fluff and filler. The 1 page length seems to cause people to think quality thoughts without forcing them to inflate the paper.
In general, you will be graded based on whether your answers seem reasonable given your results and the
above pictures. I'm going to try to grade y'all on the
quality of your thoughts, not your writing ability. You need to
communicate your thoughts clearly, but it's ok if your grammar isn't perfect.
(You should spell your words correctly; use a spell checker if that helps).
If English isn't your
primary language this should be particularly reassuring.
For this part you need to hand in a Word .DOCX or .PDF file that contains
The copy of the output from your program
(Put this at the end of the
document and then refer to it in your discussion)
About a page of single-spaced essay describing whether your results seem
to be consistent with the results from Class A and Class B (as described
above).
Note that the page of writing is IN ADDITION TO THE OUTPUT.
The output doesn't count towards the length of your writing
You may find that extra code and/or unrelated code has been included in the starter project. This was done intentionally, in order to start getting you used to work on larger projects. It's very normal for programmers to work on files where they don't actually need to change/modify the entire thing. Please remove this unrelated code, so that your program doesn't include these unrelated methods/comments.
In general, you should make sure to do the following before handing in your project:
All variables used should have meaningful names.
The code should be formatted consistently, and in an easy to read format.
Group Work, Commenting:
You are allowed to work in groups for this assignment. You are not required to, but you may work in a pair (i.e., you and one other person) for this assignment. More than 2 people working together on the same code will be considered cheating.
Additionally, you should comment your code sparsely but effectively, paying particular attention to areas that are difficult to understand. If you found something to be tricky when you wrote it, make sure to comment it so that the next person (the instructor, who's grading you) understands what your code is doing. Look at the code you’re writing and ask yourself “Is this tricky/non-obvious?” and/or “What would help me remember how this works if I were to leave it alone and then come back to it after, say, 6 months?” Then comment those spots and leave the rest of the code uncommented. It is not necessary to comment every single line.
The purpose of requirement is to both help you understand, and have you demonstrate, a thorough understanding of exactly how your program works.
Every file that you turn in MUST have:
At the top of each file that
you normally edit, you should put your name (first and last), the name of this
class (“BIT 142”), and the year and quarter, and the assignment number,
including the revision number, which starts at 0 (“A2.0”). If you’re handing
this in again for a regrade, make sure to increase the minor version number by
one (from “A2.0”, to “A2.1").
You normally edit the C# source code files (.CS files), and any Word documents
that you're handing in (if any).
You do not normally edit the .SLN or .CSPROJ files, and so you should not try to
put this identifying information in those files.
What to turn in:
A single electronic folder (a directory), compressed in a .ZIP file. This folder should contain the source code for the program – all the .CS files in your project. Please only include the source code files and NOT the Solution / Project files, nor any other files.
You should not include the bin, obj, or .vs directories, or anything from it. I will dock you a couple points if you do.
How to electronically submit your homework:
There's a link on the homework page to the document that guides you through handing in your work.