Evolution of Earth
Systems
The
Out of the rolling ocean the crowd
came a drop gently to me,
Whispering I love you, before long I die,
I have travel'd a long way merely to look on you to
touch you,
For I could not die till I once look'd on you,
For I fear'd I might afterward lose you.
Now we have met, we have look'd, we are safe,
Return in peace to the ocean my love,
I too am part of that ocean my love, we are not so much separated,
Behold the great rondure, the cohesion of all, how
perfect!
But as for me, for you, the irresistible sea is to separate us,
As for an hour carrying us diverse, yet cannot carry us diverse forever;
Be not impatient--a little space--know you I salute the air, the
ocean and the land,
Every day at sundown for your dear sake my love.
In this activity you will analyze several graphs and maps containing data on the world’s oceans. For each of the topics below, right a detailed interpretation of what the graphic shows, followed by an explanation of why it looks that way (work collaboratively with a partner, and refer to Chapter 5 of your text). Write your answers on a separate sheet.
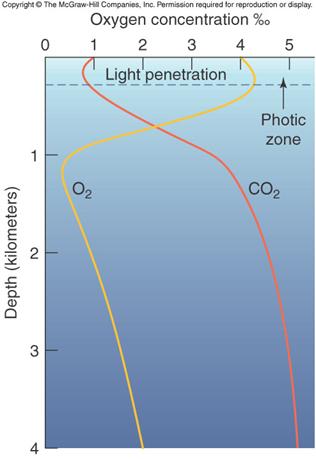
- Vertical distribution of dissolved oxygen and CO2
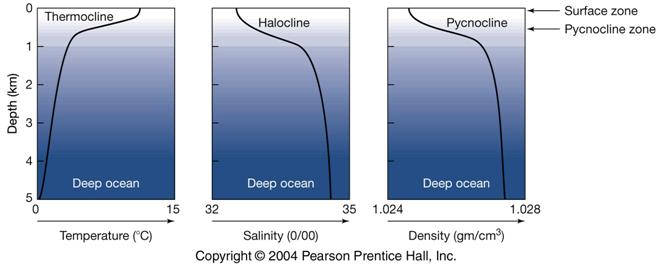
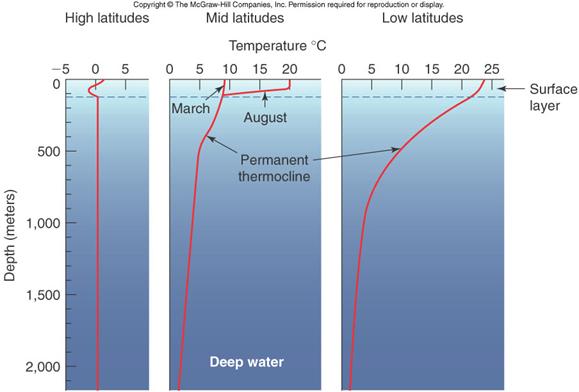
- Vertical distribution of temperatures
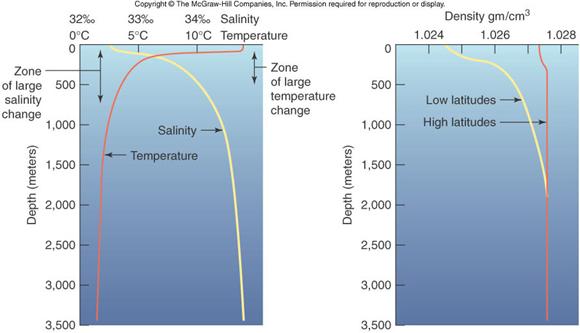
- Vertical distribution of salinities
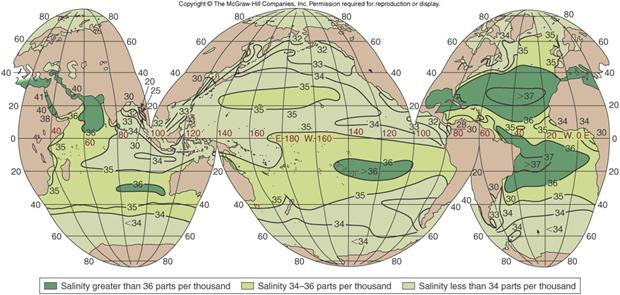
- Spatial distribution of salinities
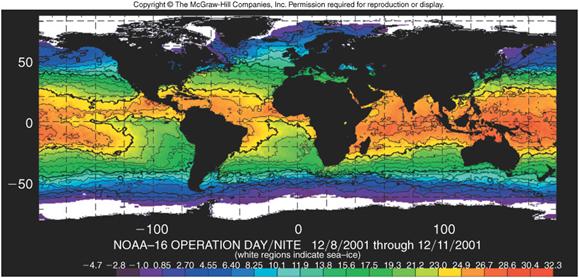
- Spatial distribution of temperatures
The first graphic is from your text. Some that follow show the some of the same data with more detail.
Figure 5-6
Vertical Measurement of Dissolved Oxygen and Carbon Dioxide in the
Oceans
Vertical Measurements of Ocean Temperature at Different Latitudes
Vertical Measurements of Ocean Salinity, Temperature, and Density
World Distribution of Ocean Salinities
World Distribution of Ocean Surface Temperatures