Evolution of Earth
Systems
Atmospheric Pressure and Wind
- A ruler and a calculator are required for this activity
Vertical air motion determines centers of high and low pressure. Ascending air reduces pressure (a Low), and descending air increases pressure (a High). The air moving horizontally to take the place of the ascending or descending air are winds. As logic would suggest, air moves away from the highs and towards the lows. The speed or strength of the winds is determined by differences in pressure between two locations. The difference in pressure between to locations and the distance between them determines the pressure gradient, which in turn correlates to wind strength. The pressure gradient between two points can be calculated as follows:
![]() Change
in pressure (ΔP)
Change
in pressure (ΔP)
Distance between points (n)
An example calculation is as follows:
![]()

1008 mb
![]()
1016 mb
ΔP 8 mb
![]()
![]() = = 0.0002 mb/m
= = 0.0002 mb/m
N 40,000m
Note: The response could also be written as 0.2 mb/km
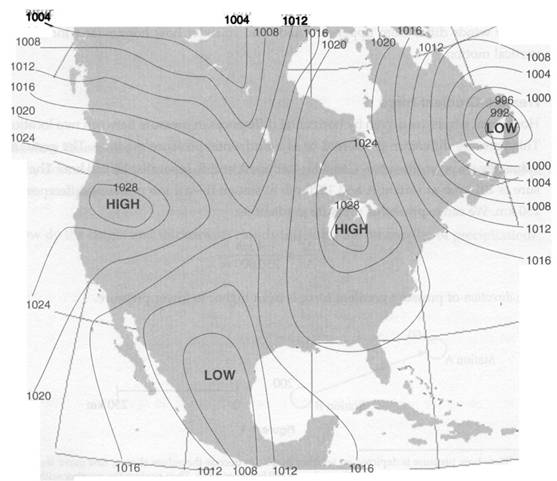
The following map of
1. Identify the area with the greatest pressure gradient (and therefore the strongest winds). Mark this on the map by outlining the area.
2. Choose three random locations on the map, and draw arrows indicating the pressure gradient force. Arrows are drawn perpendicular to isobars, i.e. the arrow cross isobars at 90 degree angles.
3. Identify the area with the lightest winds. Mark this on the map by outlining the area.
4. Where on the map is it likely to be stormy? How do you know?
5. Describe winds in
western
6. Determine the pressure gradient between points indicated by black dots on the map. The map scale is 1cm = 300km.
![]()
![]()