Evolution
of Earth Systems
Profiling the
Atmosphere
The study of Earth’s atmosphere involves gathering and analyzing data on a variety of physical parameters. In this activity, you will examine temperature data compiled from both balloon-launched radiosondes and rocketsondes.
Outcomes expected at the culmination of this activity include the following:
- Students will work collaboratively to thoughtfully examine data, determine the best visualization for analyzing the data, and offer feedback on the quality and accuracy of each member’s final product;
- Students will use graphing techniques to extract information about the structure of the Earth’s atmosphere and hypothesize as to the explanation for observed phenomena
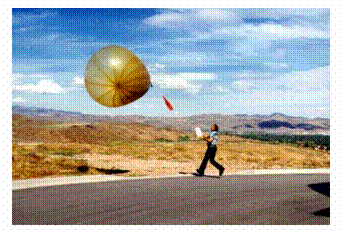
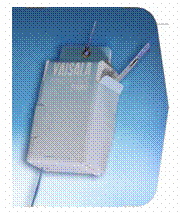
The data provided in this exercise is data collected from instruments known as radiosondes and rocketsondes. A radiosonde is an instrument package transported vertically into the atmosphere by balloon, and collects data on temperature, altitude, humidity, wind speed and direction, and atmospheric pressure. The following are photos of the radiosonde instrument and balloon release:
 Radiosondes are
useful from sea level up to about 30 km.
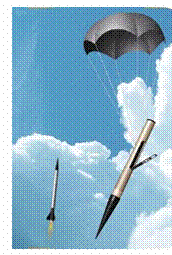
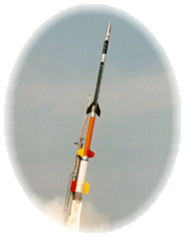
Beyond that, the instrument must be released from a rocket, and is thus
named a rocketsonde. A rocketsonde can
gather data to about 100 km (see photo left).
Radiosondes are
useful from sea level up to about 30 km.
Beyond that, the instrument must be released from a rocket, and is thus
named a rocketsonde. A rocketsonde can
gather data to about 100 km (see photo left).
More detailed information on radiosondes and rocketsondes are available at the following sites:
http://tgsv5.nws.noaa.gov/er/gyx/weather_balloons.htm
http://www.aos.wisc.edu/~hopkins/wx-inst/wxi-raob.htm
http://earthlab.meteor.wisc.edu/~hopkins/rockets/metrockl.htm
Instructions:
- Hypothesize with your group regarding the temperature structure of the atmosphere. How do you expect temperature to change as you depart from sea level and go up? How do you know?
- Join in a whole class discussion regarding your hypotheses and reasoning.
- Use the attached data table to verify or disprove your hypothesis. Is the table easy to read? How readily can you visualize the actual structure?
- Obviously, a graph would better assist you in truly seeing how the temperature orf the atmosphere is distributed. Discuss with your group what type of graph is best.
- Typically, a line graph, with altitude as the y-axis and temperature as the x-axis, is used. However, this may not be the best for you. Construct a graph that helps you visualize the data most easily.
- When constructing the graph, remember that all good graphs have a title, labeled axes (with units), and, if necessary a key. They should be constructed neatly and with the utmost care.
- Once the graph is complete, examine it, and determine if it verifies or disproves your original hypothesis.
- Discuss the following questions in your group:
- Could you have created a correct hypothesis without the data? Why?
- What is unusual about the actual structure?
- Is there a way to divide the atmosphere into zones or layers based on the graph?
- What mechanisms may be responsible for some of the unpredicted patterns you see?
- After completing your small group discussions, rejoin the large group to share ideas, and continue labeling your graph.
- Following completion of the large group discussion and graph labeling, write a page reflection on the activity. Consider the following questions: 1) What part(s) of the activity made it a scientific investigation? 2) Why was the graph important in reaching new conclusions? 3) What did you learn about the atmosphere as a result of this activity?
Combined Atmospheric
Temperatures from
Rocketsonde and Radiosonde
Platforms
|
Temperature (°C) |
Altitude (km) |
|
15 |
0 |
|
1 |
2 |
|
-40 |
7 |
|
-62 |
10 |
|
-61 |
16 |
|
-56 |
26 |
|
-48 |
31 |
|
-20 |
37 |
|
15 |
45 |
|
-40 |
61 |
|
-95 |
75 |
|
-90 |
82 |
|
-40 |
105 |
|
-5 |
120 |